Introduction
This application allows to simulate the transient and steady state of the Induction Motor and to display the curves and the values.
It allows to apply 3 operating modes:
Direct start on the grid.
Fixed rotor shaft test.
Speed drop test (slowdown).
Thank you for considering a 5-star vote for this app, which will allow its wide dissemination to the community of students and teachers of Electrical Engineering.
If you have any concern, please let me know before voting , by email:
I could certainly provide explanations, without getting a vote below 5 stars.
I am a teacher-researcher in EE: Researchgate Profil
Thank you for encouraging the development of this kind of apps, by contributing through an in-app purchase of the Premium offer, for 2.99 USD (+ local taxes).
Summary
The Induction Motor (IM) app helps students and teachers to study IM transient and steady state operating modes.
Several events can be applied during the simulation, such as changes in the load torque at different times.
Simulations can be shared and exported to other apps (Gmail, photos, Excel sheets, documents).
Main characteristics:
Simulation of Induction Motor (IM) transients on a start-up and display of curves, instantaneous and steady state values
Curves of phase current and voltage, electromagnetic torque, speed, thetas, V RMS, I RMS, cosPhi, P, Q, S versus time and in steady state
Apply Clarke and Park transformations to 3-phases variables (voltages and currents)
Simulation of fixed shaft and speed drop operating modes to measure IM characteristics
Change motor parameters and save them in local files
Apply multiple load torques events in the simulation
Parameters of simulation (final time, step time, startup, machine changes, frequency, grid voltage drop, initial speed for non-powered speed drop operating,�)
Display up to 4 curves by splitting the graph window in 2x2 curves
Premium Version:
Additional events (Voltage, Stator and Rotor resistances changes) instead of only load torque events
Load previously saved configuration, and also share them by email
Export data: graph images, graph data (xls/csv), machine parameters
Video
Navigation
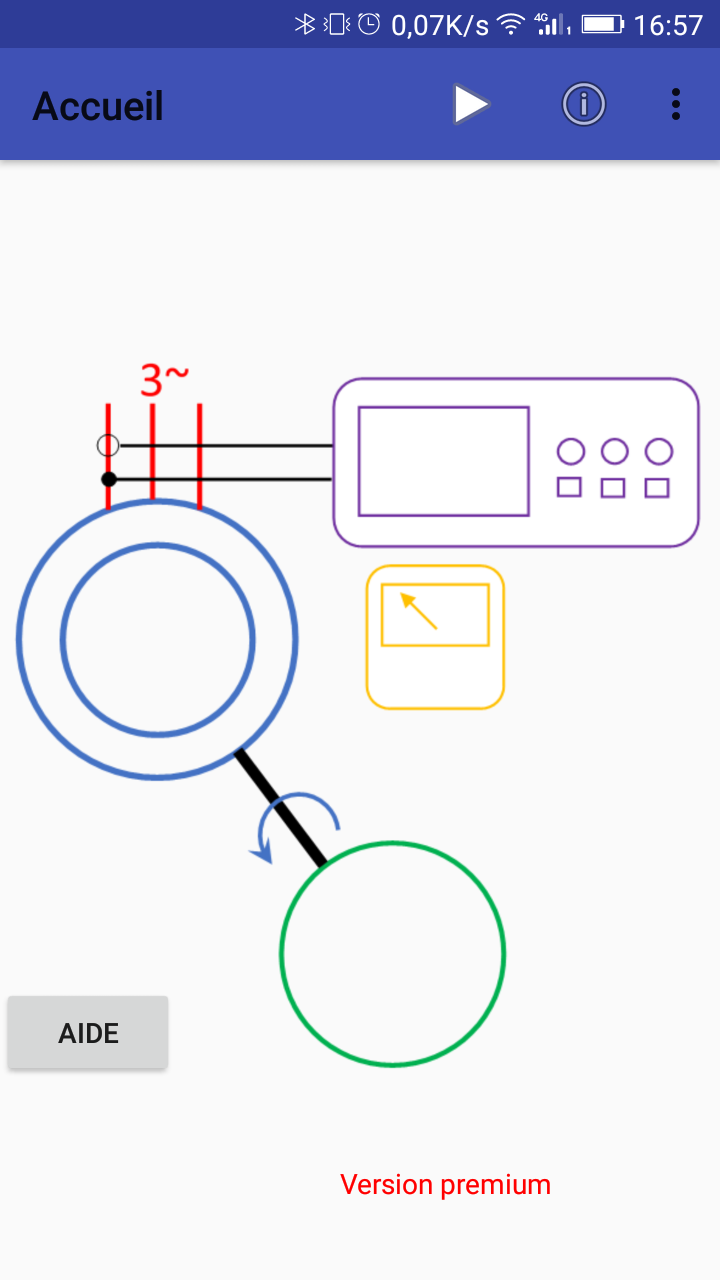
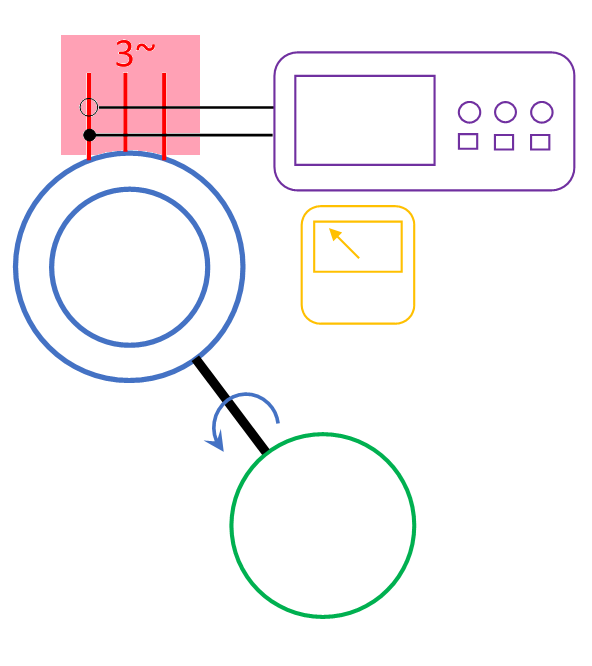
Through 6 screens or views, you access the different configurations and parts of the application.
You navigate by sliding (swipe) the different views laterally or
By selecting the corresponding view from the menu
You can also, from the home screen , ,
Click on the part of the diagram that represents the configuration or the view in question.
Simulation: Click on r�seau triphas� (rouge) to access simulation parameters.
Curves: Click on oscilloscope (violet) to display curves.
Results: Click on multim�tre (yellow) to display results.
Events: Click on charge (green) to access simulation events.
Parameters: Click on Induction motor (blue) to change parameters.
Simulation
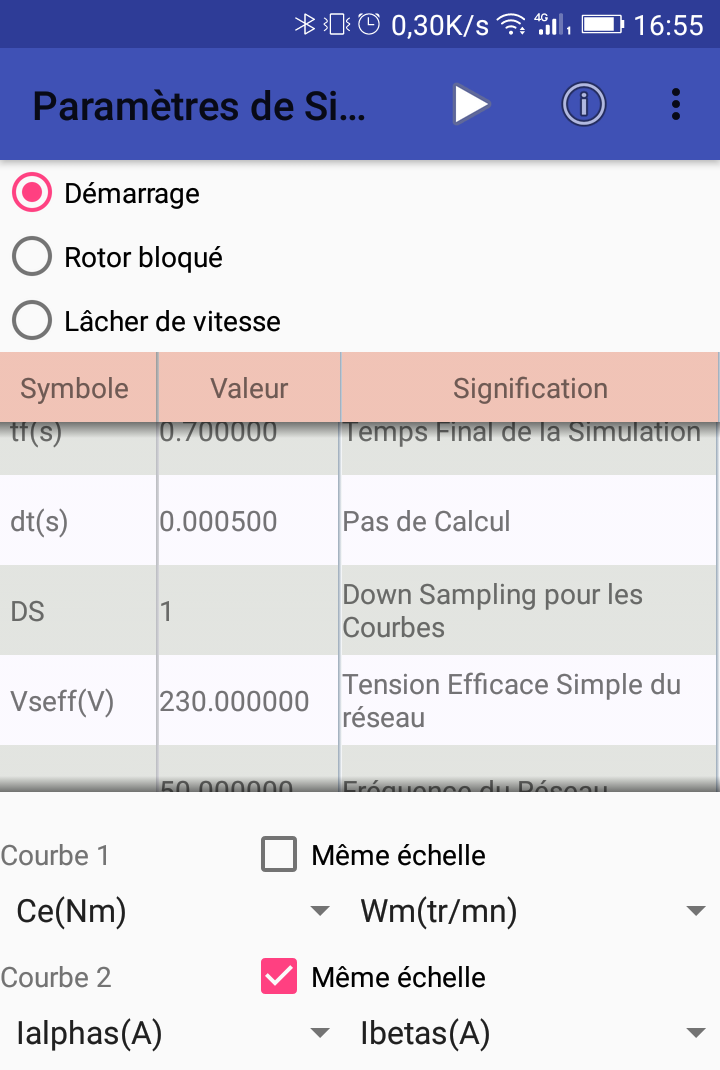
The "Simul. Parameters" view allows you to choose the different simulation options to apply.
By clicking on the red part of the diagram on the home screen.
Direct start on the grid.
Fixed rotor shaft test.
Speed drop test (slowdown).
The start is used to simulate the behavior of the IM during a direct start on the grid, for which the phase voltage Vsref (V) and the frequency fs (Hz) are imposed.
These parameters are changed by a long press on the table row.
We choose the simulation time (tf), the calculation step (dt = 5.e-4s)
The DS (down sampling) allows you to save only one point every DS (10 for example).
This is particularely useful when the IM time constants are small and you need to reduce the calculation step but do not want curves with too many points that would make their display and manipulation heavy.
The Fixed rotor shaft test uses the VRB (V) voltage to perform the simulation under a reduced voltage.
We obtain a sinusoidal current which is established after a short transient. VRB (V) is chosen to have a RMS value of the current close to the rated current.
The active and reactive power readings allows to determine the parameters of the rotor resistance (Rr ') and the total leakage inductance to the rotor (Nr') brought back to the stator.
The Speed drop test or slowdown test uses the WmSD(rpm) as the starting speed for the test, that is, operation unpowered (no electromagnetic torque).
Only friction occurs in the mechanical equation and therefore acts on the speed of the IM.
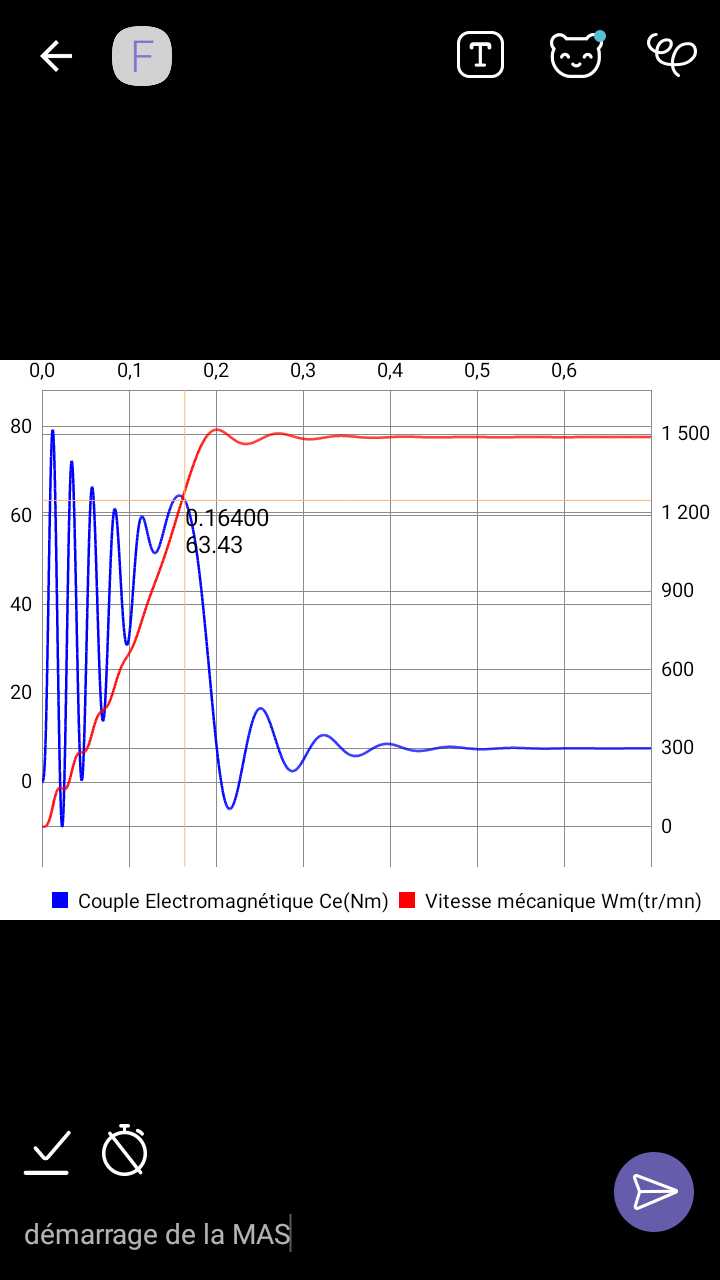
Curves
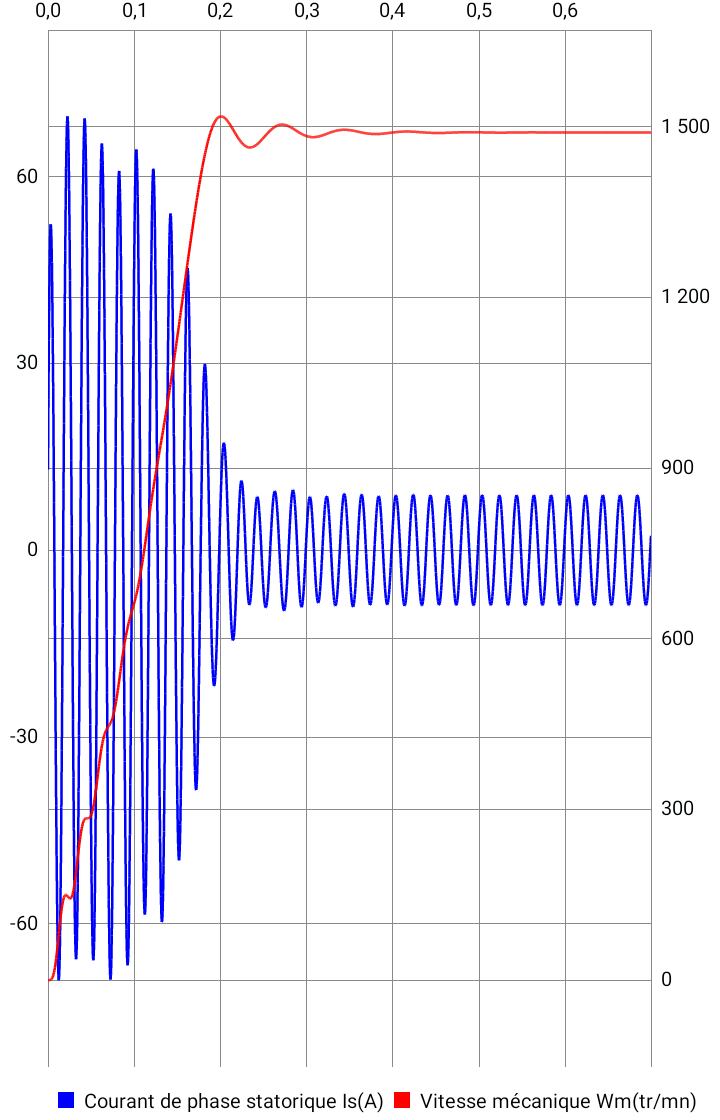
The "Curves" view allows you to see the instantaneous curves of the motor variables.
It is also accessed by launching the simulation using the Run icon
The results are then displayed:
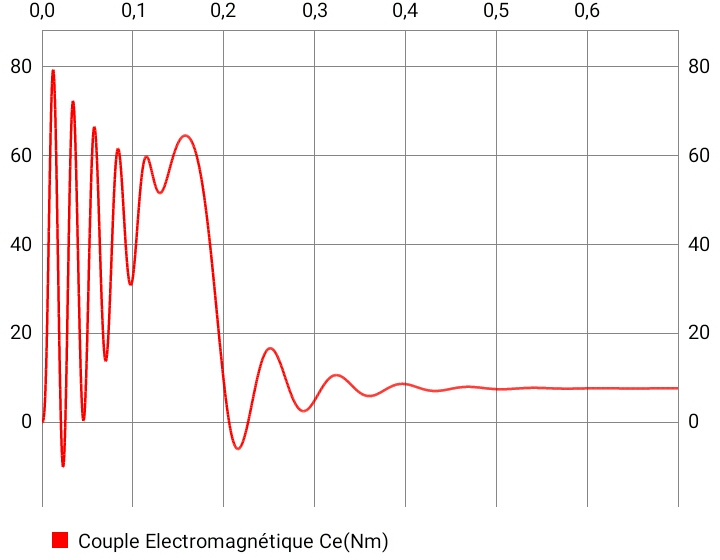
Several type of variabales can be displayed as a function of simulation time, such as, the instantaneous electromagnetic torque:
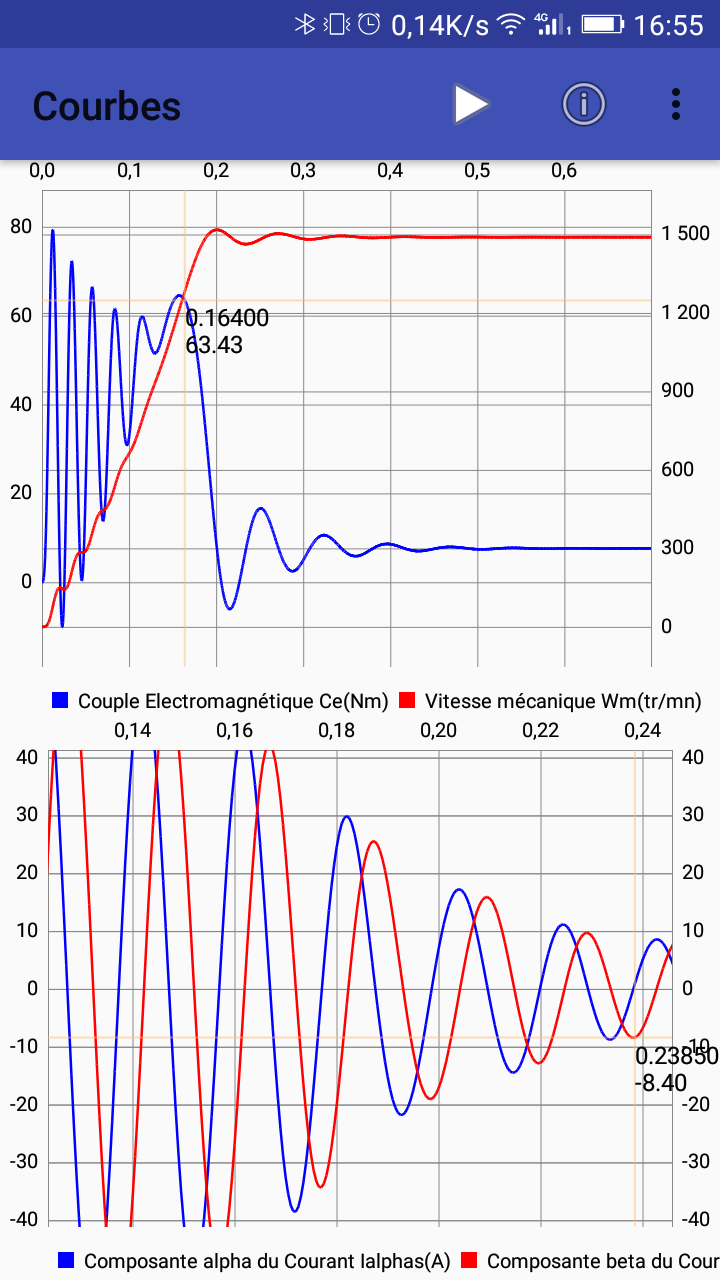
In the Simulation part, you can choose which curves to display, up to two variables per curve and up to 2 curves per window.
Each variable may have its own scale on the Y-axis or a common scale.
Choosing the same scale on the Y axis is interesting when you want to display the powers P and Q for example or the currents Ialphas and Ibetas.
eut afficher les puissances P et Q par exemple ou les courants Ialphas et Ibetas.
Results
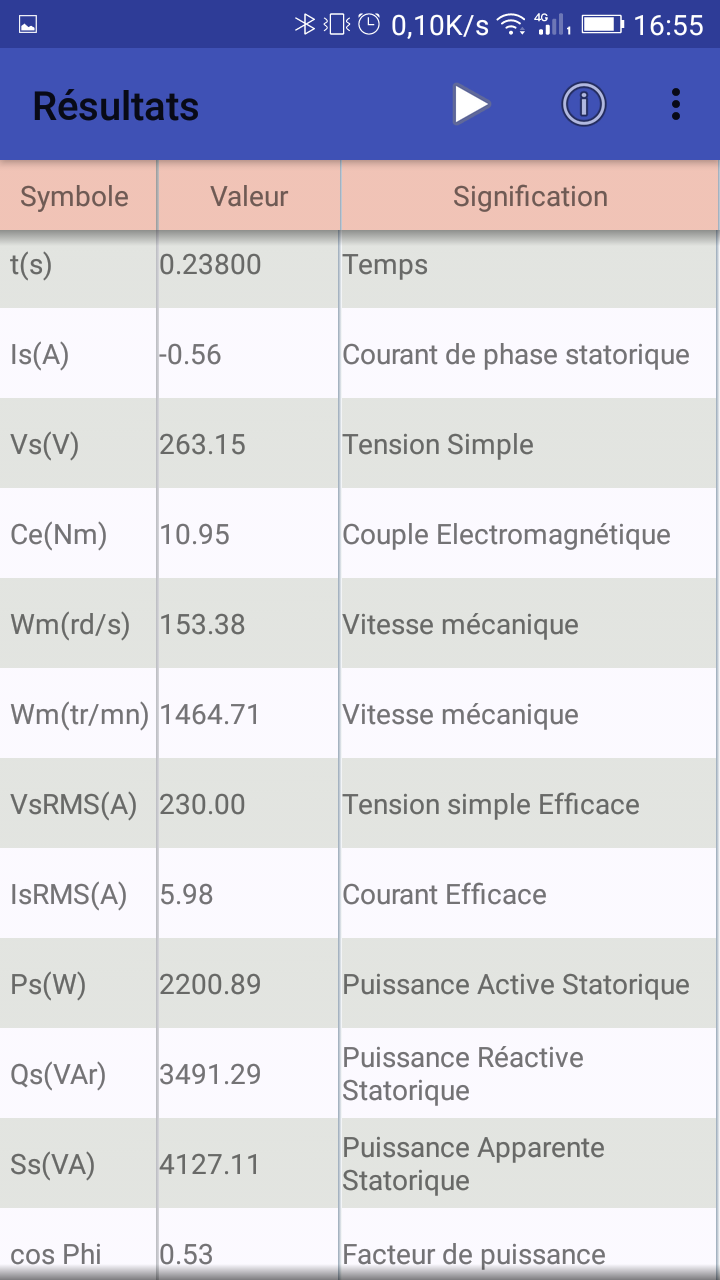
The "Results" view shows the numerical values of the variables for a given operating point.
This point corresponds by default to the end of the simulation.
However, if you click on the curves, a point appears and the calculation is redone for this point.
It's best to navigate to the Results view, with the menu to avoid changing this point, by dragging the view laterally.
It is thus possible to calculate the variables even if their graph has not been plotted.
Events
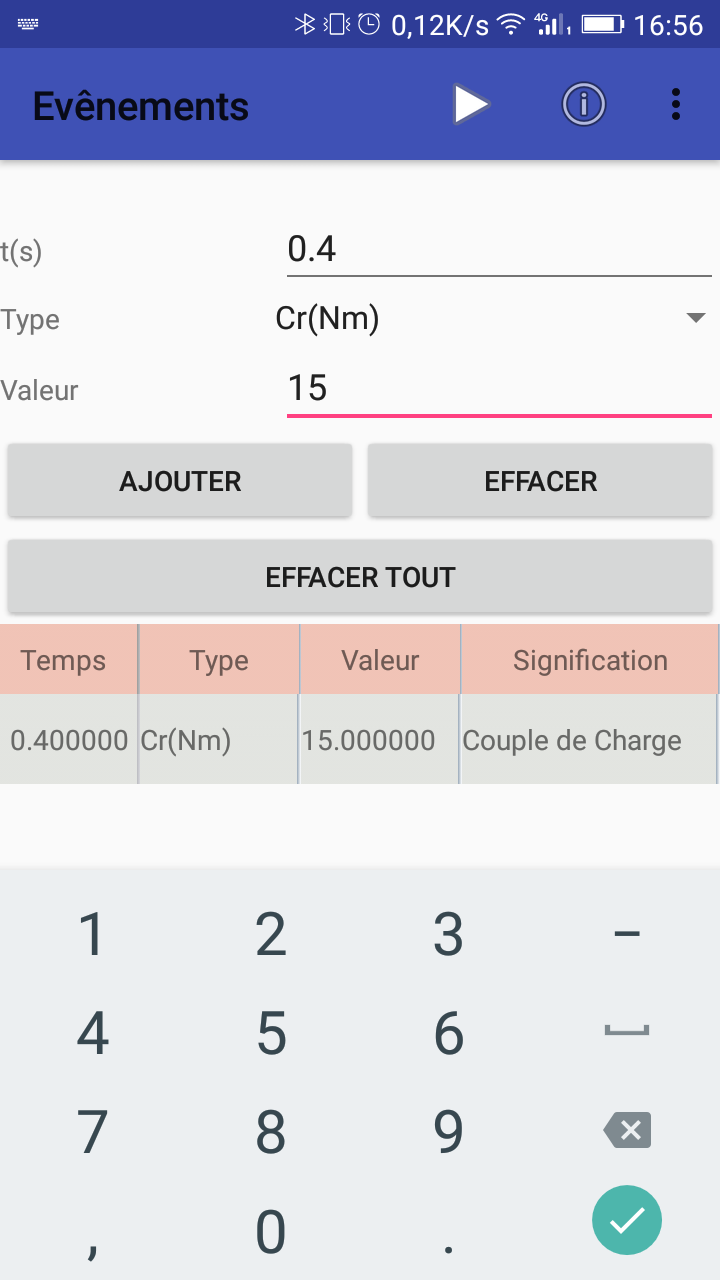
The "Events" view allows you to choose the different events to apply.
A long press on a row of the added events table allows you to change the application time of the event and its value.
Several events can follow one another, for example Cr = 10 Nm at t = 0.4s, then Cr = 30 Nm at t = 0.8s.
Other types of events can be added such as voltage changes, stator resistance and rotor resistance ( Premium option).
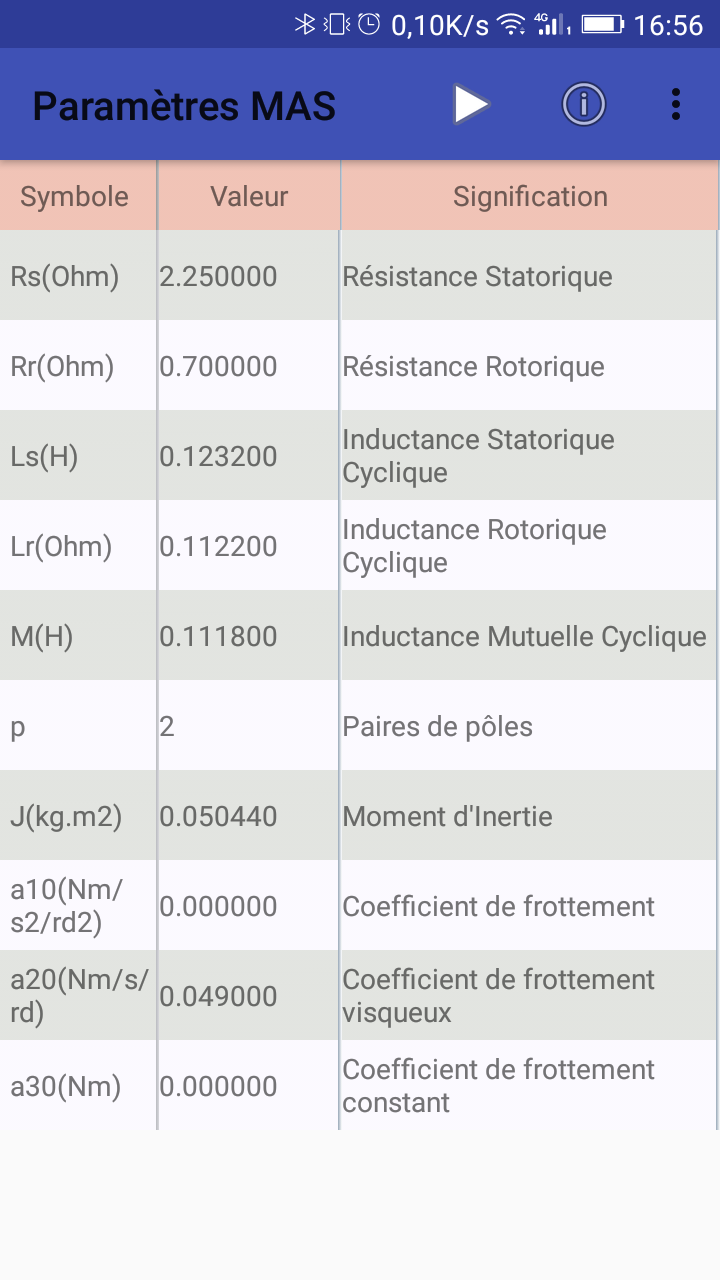
IM Parameters
The "IM Parameters" view allows to choose the different electromagnetic and mechanical parameters of the induction motor.
The menu also allows you to choose IM Parameter saving .
The chosen name must have a .imcfg extension to be recognized when receiving such a file sent via Gmail or other programs.
You can also choose Loading Settings from backups, this is a Premium option.
The Share menu (Premium) allows you to send the IM parameters file to other devices / users, for example via Gmail.
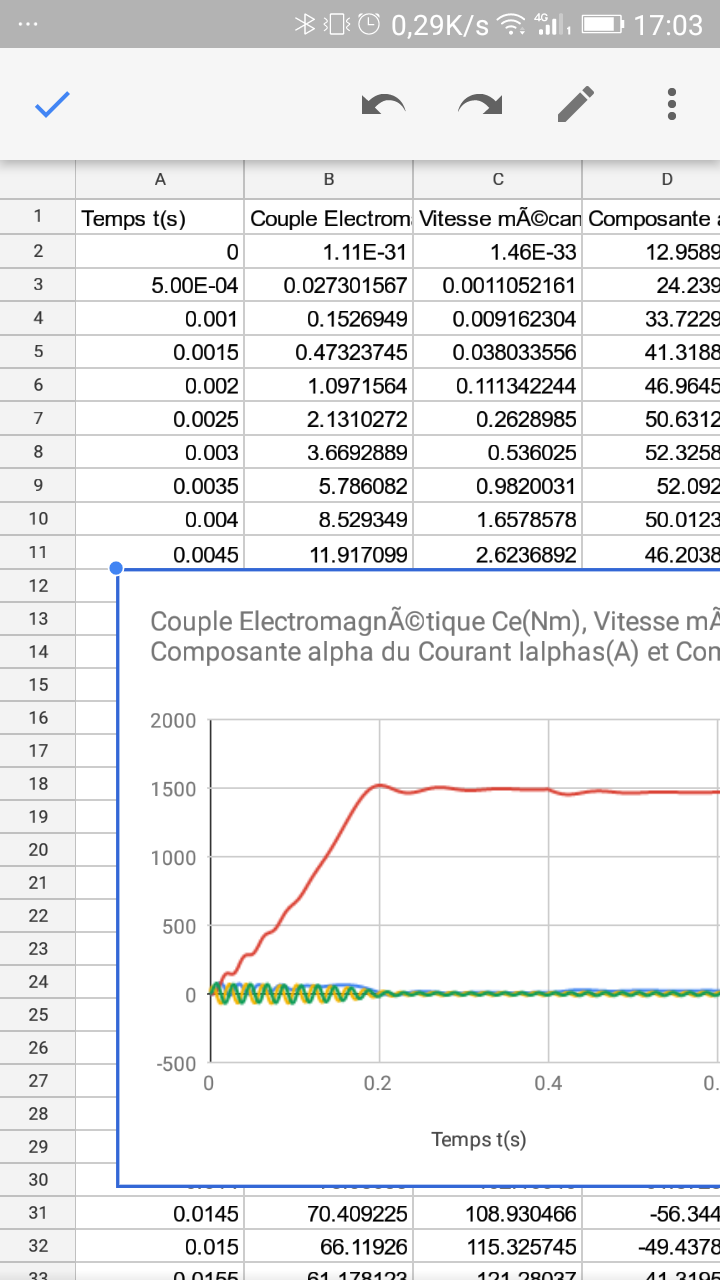
The Exports menu (Premium) is extremely useful and allows you to send the curve image to other apps, such as File Manager, Viber or Gmail.
For data, you can send the data to the file manager to save a file, data .csv for example, which you can then send by email or open with Excel or Sheets app.
This very interesting option makes it possible to use the results of the simulation later using the generated .csv file.
Example, for the speed drop test, learn how to identify the parameters of the friction torque from the slowing curve.